The Art of Nomography
23/04/2020, V.A.Esaulov
Prior to the widespread of computers, graphic calculation methods were a popular means of quickly solving scientific and technical problems, that would otherwise have required tedious calculations. This is distinct from graphical representation of data obtained numerically using computers, that we widely use today, for illustration purposes and to get a qualitative “feeling” of the behaviour of physical quantities as a function of some parameters.
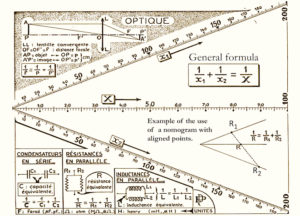
In the 19th century, graphical methods were designed to determine values of some parameter as a function of values of other parameters, that could be related by mathematical expressions. This led to the appearance of the so called “Nomography”, a word coined around 1884 by the Frenchman Maurice d’Ocagne (1862-1938), which comes from the Greek nomos meaning law. Nomography developed into a very efficient and popular graphical tool for engineers, scientists and doctors to obtain acceptably accurate solutions in diverse applications. In the very simplest form a nomogram consists of a chart with two juxtaposed scales allowing conversion of e.g. degrees Fahrenheit to Celsius like on a thermometer. In most cases nomograms have three or more straight or curved scales, which may be logarithmic allowing solution of more complex problems (see example in figure 1a).
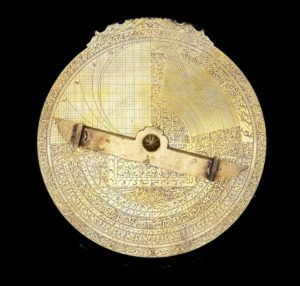
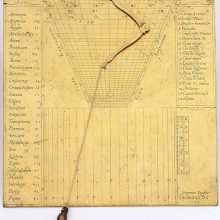
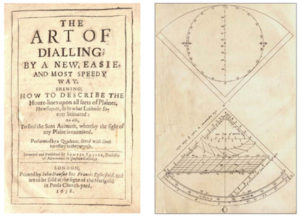
Figure 1. (a) Lallemand type nomogram (see text) for evaluating common relations in optics and electricity. determining the value. (Adapted from P.Poignon’s book) (b) An Islamic Astrolabe (Source MuslimHeritage.com (c) Regiomontanus dial for latitudes 30°-66° North. The face of the dial is engraved with several scales, a graduated triangular network of lines and set off vertical lines. An articulated arm holds a plumb line allowing to place it at a given point of the two-dimensional network. The variables are the geographical latitude, the solar declination, the solar time, and the height of the Sun. Signed ‘Iohannes Krabbe Mündensis Faci: 1584’. For more information regarding this dial please refer to the OUP & NMM catalogue, ‘Sundials at Greenwich’. Courtesy Royal Museum Greenwich. (d) Cover page of S. Foster’s 1638 book on sundials and an image of graphical constructions including a circular one of the type seen much later in the work of Clarck 1905. (Source British Sundial Society)
Two aspects made such graphical calculations popular: just as the Galilean sector, they are on the one hand very fast (they were used on battlefields in artillery) and on the other hand are accessible to people without any extended knowledge of mathematics. It is thus noteworthy that in the beginning of the 20th century technicians with a minimum knowledge of mathematics could graphically obtain solutions of differential equations by the successive approximation method (Andrade 1905).
Historically, some aspects of graphical tools described here, may already be found in much earlier works on astrolabes by Islamic scholars in the Golden Age years figure 1b) . A more recent example in Europe is the Regiomontanus (or Johannes Müller von Königsberg, 1436 – 1476) sundial shown in the figure 1c, or sundials in the text by Samuel Foster “The Art of Sundials” (figure 1d.).
In the following we look briefly at how this graphical field of computation developed in the 19th century, avoiding going into the mathematical background, which the reader may find in the cited texts. The theory of nomograms relies on analytic, descriptive, and projective geometries, some algebra, and other areas of mathematics. The developments in this field are related to the prior development of logarithms and slide rules. Ocagne actually classified various types of slide rules as nomo-mechanical calculators. It is noteworthy however, that when using slide rules, one performs a series of operations to solve equations for a wide variety of problems, whereas a nomogram provides generally a one-step solution to a given problem.
We do not touch here upon purely geometrical construction methods using a ruler and compass. The focus is on specially constructed graphics, which represent the solution of a certain type of mathematical problem for different values of variables (parameters) from which the solution can be directly read-off. Much more complete renderings of this fascinating subject can be found in the contemporary texts of e.g. Evesham (1986,2010), Doerfler (1993), Tournès (2000) and others cited below.
The beginnings and L-E Pouchet.
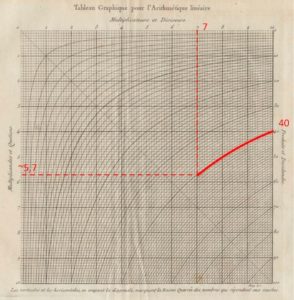
Some kind of graphical constructions were used much before the 19th century, but the notion of graphical calculationsonly seems to appear for the first time in 1795 in a book by the Frenchman Louis-Ezéchiel Pouchet (1748–1809) in the period of the French revolution. Initially Pouchet proposed geometrical construction methods involving the use of graphics with series of lines to be used along with a divider/compass. In 1797 he proposed the use of an abacus (in French abaque) or graphics from which results could be directly read. An example of this was Pouchet’s representation of the multiplication table z=x*y, by a graphics table with a family of equilateral hyperbolae. Given a value of x=a and y=b the abacus gives the hyperbola xy=c. In Figure 2. values of c are represented on the right ordinate scale. For instance, for c=40 and x=7, following the c=40 hyperbola the intersection with x=7 corresponds to y~5,7.
Pouchet was considered by many of the following developers as the father of graphical calculations. Pouchet’s method saw some minor developments in the following years. Amongst these in the early 19th century was the application of graphical solutions for ballistics (see Evesham). However, the main innovation is due to the French engineer L.L. Lalane.
L.L. Lalane and anamorphosis.
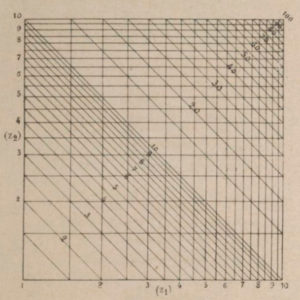
Around 1840, Léon-Louis Lalanne, an engineer of the Ponts et Chaussées, had the idea to modify the graphical table of Pouchet by replacing the linear axis scales by some functional form. In the case of the x*y=z this consisted in using logarithms and rewriting the multiplication as the sum: log x + log y = log z. The use of logarithmic scales obviously leads to representation of the family of Pouchet curves by straight lines as illustrated in figure 3. The checkerboard appearance of Pouchet’s table led Lalanne later to call it an abacus.
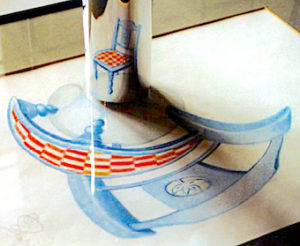
Lalane termed this procedure anamorphosis, referring to optics. The word “anamorphosis” is derived from transformationin Greek: the prefix ana‑, meaning “back” or “again”, and the word morphe, meaning “shape” or “form”. Indeed, it was already known that by appropriate choices of curved mirrors a distorted shape could be seen in its original undistorted form, as illustrated on the case of the distorted image of a chair (figure 3b). Lalanne named this new branch of Geometry: Anamorphic Geometry.
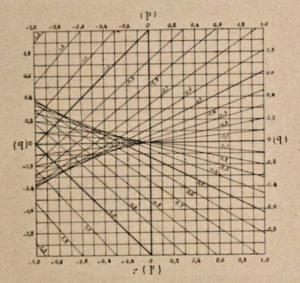
Lalane expressed a number of interesting ideas and considered various extensions starting with application to functions of the type z= f(x)*g(y) and z=f(x)+g(y). Augustin-Louis Cauchy and others (Cauchy 1843) remarked about Lalane’s 1843 Academy of Sciences paper that his approach could be generalised to the case:
F(z) = X(x)f(z) + Y(y) y(z)
where F(z), f(z), y(z), are functions of the variable z, which one supposes to be a function of x and y. This was taken up later by Lalanne in his 1846 work.
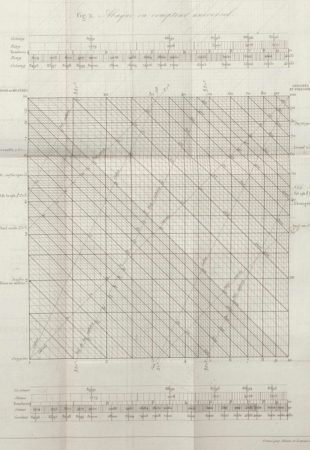
Lalanne is well known for proposing a Universal Calculator (Abaque ou Compteur Universel) that he hoped could be used to replace the slide rule. His Universal Calculator, with which a number of calculations could be carried out is shown in figure 5. Amongst these are multiplication and division; raising to powers and finding the corresponding roots; multiplication and division by 2pi; determination of the area of a circle and volume of a sphere as well as solutions of ratios to find chemical equivalents. Lalanne hoped his abacus would find wide use in various walks of life from schools to engineering workshops, but this did not happen. A number of Lalanne’s abacs appeared in the book by L.F. Kamtz.
Lalane pointed out that anamorphosis is not confined to Cartesian coordinates but can be applied to polar coordinates or any coordinate system and he illustrates the point with reference to the hyperbolic spiral R.w= a * a which, with the substitution R =log R, w = – log w becomes an Archimedean spiral. He did not however go into formal demonstrations of the validity of his propositions, which remained mainly intuitive. The formal mathematical development of subject however did not progress much for a number of years.
Paul de St. Robert
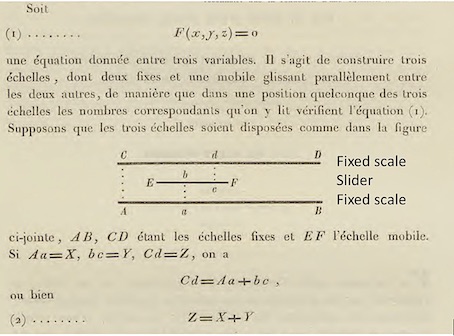
Concerning the slide rule and formal developments, it is interesting to mention Paul de Saint Robert. He thought of using a variant of the logarithmic slide rule to double entry tables. He was trying to understand if it was possible to make a slide rule that would give the solution to F(x,y,z) = 0 using an anamorphic transformation to the form Z(z) = X(x) + Y(y), with two of its scales representing e.g. X and Z and the slider Y. His slide rule would have worked as illustrated by him in his 1867 presentation (ref xx, p54; figure 6 here).
This is obvious using logarithms for cases like z=x*y or f(z)=g(h)+h(y). With a little use of differential calculus Saint Robert deduced a criterion defining when an equation of the type F(x,y,z) = 0 could be transformed into an equation of the form Z(z) = X(x) + Y(y). Presented in 1867, this was possibly the first serious mathematical derivation in this context.
Further developments: Massau.
A few years passed before substantial new developments appeared. The problem of simple anamorphosis (of the Cauchy form X(x)p(z) + Y(y)q(z)=1 ) was solved by the Belgian Junius Massau (1852-1909) in 1984 and independently by the French engineer Léon Lecornu (1854-1940). Both demonstrated the necessary and sufficient conditions for a function F(x,y,z) = 0 to be reducible to this form. J.Massau did a considerable amount of work on graphical integration and nomography and published two large works on the subject.
Massau introduced a notion of generalized anamorphosis. He argued that if one carries out a change of coordinates of the type x = p(u,v) and y=q(u,v), this results in the deformation of the plane, but does not alter the fact that the three lines have a common intersection point and thus does not change the operation of the abacus. He then sought to determine the type of the functions that could be represented using three families of lines, without imposing two of these to be parallel to the coordinate axes. He did this using determinants, which were thereafter extensively used. This constitutes one of his major contributions to the field of nomography.
Hexagonal charts of C. Lallemand.
Starting from around 1883 C. Lallemand developed his hexagonal abacus, presented publicly to the Paris Academy of Science in 1886. He argued that Lalane’s charts remained complicated to use because of the large number of lines and that a simpler presentation based on anamorphosis could be made using a different type of diagrams.
The basis of these, is the fact, pointed out by Lallemand that (see figure 7a): the algebraic sum of the projections (AD, BE) of a segment of a line (XY) on two axes (OU, OV) set at a 120° angle to each other, is equal to the projection (CF) of the same segment onto the internal bisector (OW) of the angle between these axes. If the segment is taken to be a line passing through the origin OX (figure 7b), then simply OA+OB=OC. The concurrent axes OU, OV and OW can then be graduated to correspond to values of functions f(u), g(v) and h(w) respectively. In order to simplify the use of this system as a nomogram, Lallemand proposed to use a transparency with a set of axes (called index lines), plotted as diagonals of a hexagon centred at X, which would correspond to lines set at 90° to the axes OU, OV and OW (figure 7c).
A notable point of this construction is that for the 2a=120° angle, the scales OA, OB and OC are the same, as illustrated by the linear divisions in figure 7c, where 6+2=8. Combining this with Lalane’s anamorphosis, irregular scales can be used by setting OA= f(u), OB=g(v) and OC=h(w) so that f(u)+g(v)=h(w). A similar abacus can be constructed for other angles between OA and OB, but the OC scale would then be adjusted by an appropriate calibration factor. A simple example of the Lalemand’s nomogram shown in figure 1a solves the equation 1/u+1/v=1/f, which corresponds to finding the value of two resistors in parallel.
This system provided significant flexibility, because the U,V,W axes need not intersect at O but any axis can be displaced parallel to itself and arranged to ease the presentation or adjust the dimensions of the diagram on paper. This includes arrangement of the scales as an equilateral triangle. Furthermore it also allows readjustment of the range of variables on the scales, without significantly increasing the size of the nomogram.
Some of these aspects are illustrated by Lallemand’s nomogram for multiplication and division (Figure 8).
Lallemand claimed that his approach presented the first general method of graphical representation of an equation of any number of variables, satisfying the sole condition of being able, directly or after anamorphosis, to be separated into a sum S of a product of two variable functions such that:
S f1(x1,y1) f2(x2,y2) f3(x3,y3) = 0
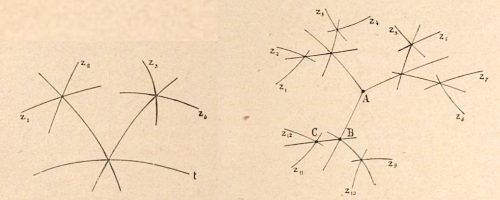
This, of course, at the cost of a significant complication of the chart. Without going into details, a way of constructing a Lallemand abacus for a four variable and a twelve variable function are shown in figure 9.
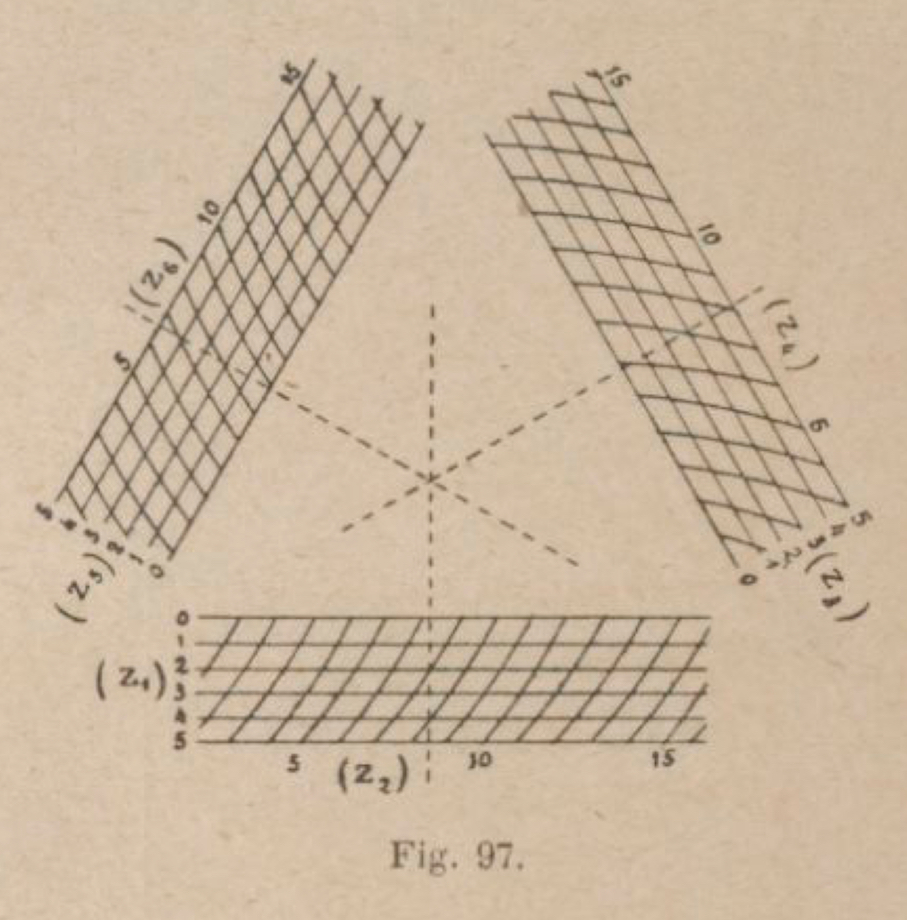
A further extension was the association of two-variable graphs to each of the three scales above as shown in figure 10. This corresponds to finding solutions for a six variable equation: f(a,b)+g(c,d)= h( p,q).
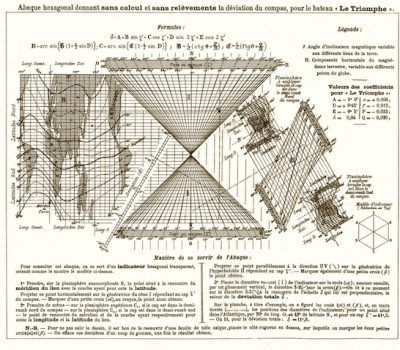
Lallemand is well known for his famous and complex looking abacus (Figure 11) for determining compass course corrections for the ship, Le Triomphe, using equations developed by Archibald Smith in 1843. The reason for this development is that even a very well-constructed compass will not point to the true (geographic) north due to the effect of magnetic (iron) parts in the ship and the variation of the angle between the magnetic north and true north based on the local direction of the Earth’s magnetic field.
Lallemand’s diagram combined the experimentally determined values of magnetic variation around the world with eight magnetic parameters of the ship, into a formula for magnetic deviation which can be calculated with this single diagram using a transparent overlay. Directions for the use of the L’Abaque Triomphe are provided along the bottom of the chart, and there is an example in dashed lines worked out on the chart itself.
Occagne and Nomography.
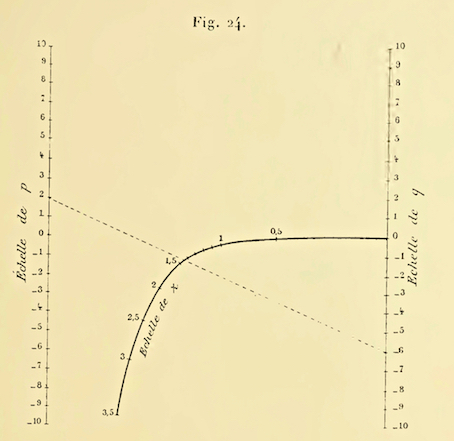
Maurice d’Ocagne (1862–1938), made significant contributions to nomography and popularised the subject in his books. His first publication “A new method of graphical calculation” dealt with solving the equation of the type xn + px + q =0, previously considered by Lalanne for n=2 and 3. He adopted an unusual set of “parallel coordinates”, in which the coordinate axes U and V are two parallel lines. The axes are graduated with the values of p and q and a third straight or curved line corresponds to an alignment of points x that are the solutions of the equation as shown in figure 12 for the cubic case (Ocagne 1884). This alignment nomogram is shown for the intersecting cursor line (isopleth) set from for p= 2 and q=-6. Note its simplicity with respect to Lalanne’s one shown in figure 4.
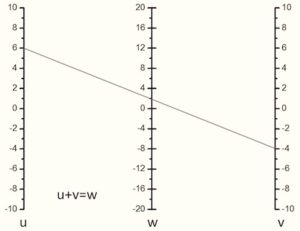
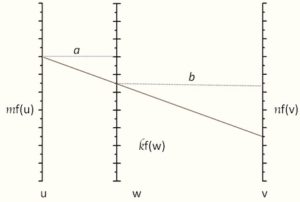
Figure 13a shows a very simple three parallel line nomogram, which solves the equation u+v=w. A more general case for the equation f(u)+f(v)=f(w) is shown in figure 13b, where scaling factors are introduced. The w axis is set at some unequal distances a and b from u and v axes respectively and the functions are plotted on the u,v,w axes and scaling factors k,m and n, are chosen for commodity. The original equation corresponds to this representation for the case m/n=a/b and k=m.n/(m+n).
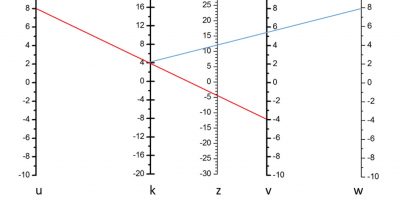
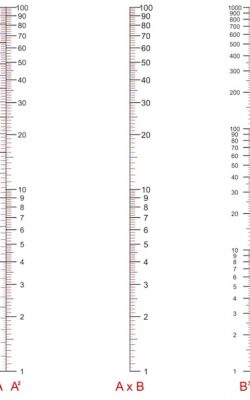
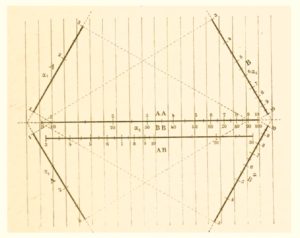
A similar approach can be used to calculate f(u)+f(v)+f(w)=f(z), by splitting into two consecutive steps: f(u)+f(v)=f(k) and f(k)+f(w)=f(z). This is illustrated in figure 14 on the case of addition of numbers u+v+w=z.5Use of logarithmic scale allows the generalisation of this approach to much more complex problems. A multiple scale nomogram, with logarithmic scales, allowing you to multiply or divide using the A,B and AxB scale, or take the square and cube of a number (A2, B3 scales) or inversely calculate the corresponding roots is shown in figure 15.
Nomography examples.
A large variety of nomograms have been constructed allowing to solve different types of problems. In the following we give some examples of different styles.
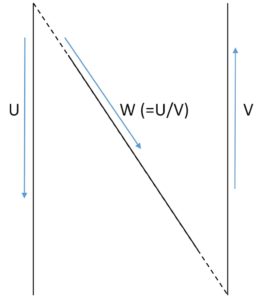
N (or Z) chart Nomograms. One can quite frequently encounter what are called N or Z chart nomograms, whose name stems from their letter resembling shape (see schematic drawing in Figure 16a). They are used to solve three variable equations of the type w=u/v or more generally f(w)= f(u/f(v). The nomogram has parallel u and v axes with linear scales plotted in opposite directions and a slanting w axis with a nonlinear scale in between. Only part of the w axis is sometimes represented.
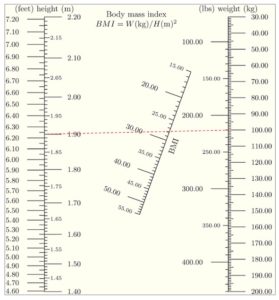
A simple example is provided by the well-known body mass index (BMI) calculation used to characterise overweight and underweight persons. The BMI is given by the relation W(kg)/H(m)2. A normal weight person is considered to have a BMI between 20 and 25. Figure 16b shows the corresponding nomogram on which the BMI is plotted on the slanting line. The index line connecting a height 1.9m to a weight of 100 kg indicates an overweight person with a BMI close to 28 (27.7).
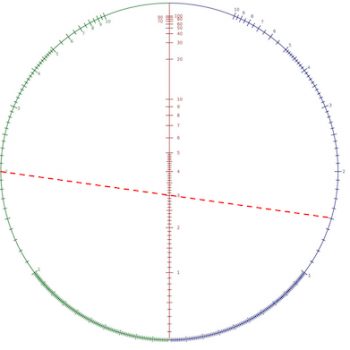
A circular nomogram by Clark (1905) for multiplication. The intersection of the index line connecting points on the circle green and blue sides of the circle corresponds to the product of the corresponding circles.
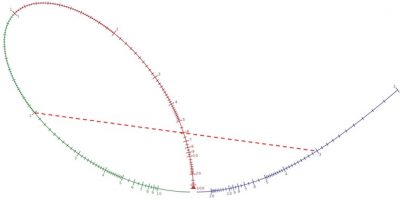
A single line multiplication nomogram by Clark (1905). The intersection of the index line with the red curve, connecting points on its green and blue portions corresponds to the product of the corresponding circles. The curve is a part of the well-known folium of Descartes from 1638, which is defined by the equation x3+y3-3axy=0.
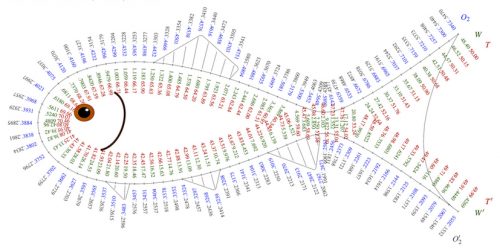
A funny “fishy” nomogram. This nomogram that resembles a fish (Figure 19), allows you to calculate the oxygen consumption rainbow trout as a function of its weight and water temperature by R. Doerfler (2008). It is based on the use of elliptic functions to create a nomogram composed of three scales overlaid on a single curve, as described by Epstein for the equation u + v + w = 0 and extending to include functions of these variables.
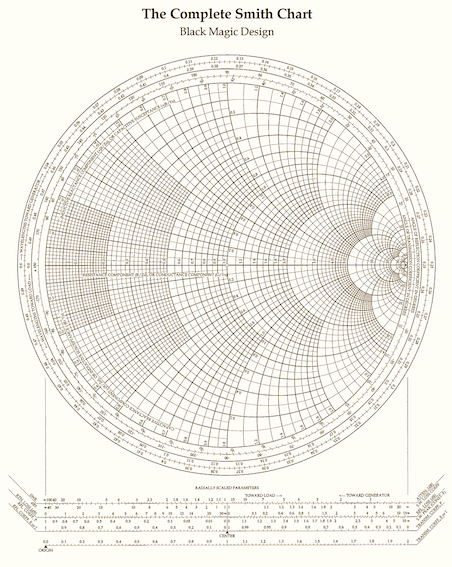
Smith chart. Finally Figure 20 shows a beautiful and complex nomogram devised by P. H. Smith and T. Mizuhashi for electrical and electronics engineers specialising in radiofrequency transmissions.
Nomography in later years.
Over the years Nomography was developed in a number of countries and has been extensively used in a wide variety of applications. These extend from calculations in ballistics, navigation and flight control in aeronautics, ordinary machine shops, statistics, various engineering problems and medical applications. With the advent of computers their usage has decreased, but unlike the slide rules they have not disappeared and you can still encounter frequently medical papers where they are presented (see. e.g. Kattana 2010, Grimes 2008).
References.
Andrade J. L’enseignement scientifique aux écoles professionnelles et les Mathématiques de l’ingénieur⟩⟩, dans Krazer (Adolf), éd., Verhandlungen des dritten internationalen Mathematiker-Kongresses in Heidelberg vom 8. bis 13. August 1904, Leipzig : Teubner, 1905, p. 622–626.
L.C. Callaghanand J. D. Walker, Anaesthesia, 2014, v70, N°2, p176-182. https://doi.org/10.1111/anae.12860,
Cauchy A.L. Rapport sur un mémoire de M. Leon Lalanne, qui a pour objet la substitution de plans topographiques à des tables numériques à double entrée (Commissaires, MM. Elie de Beaumont, Lamé, Cauchy rapporteur), Comptes Rendus Hebdomadaires des Séances de l’Académie des Sciences, 17 (1843), p. 492–494.
Doerfler R., Creating Nomograms with the PyNomo Software Version 1.1 for PyNomo Release 0.2.2, http://www.myreckonings.com/wordpress
Doerfler R., 1993, Dead Reckoning Calculating Without Instruments, Gulf Publishing Company. ISBN-10: 0884150879
Doerfler R. 2020b, Lallemand’s L’Abaque Triomphe, Hexagonal Charts, and Triangular Coordinate Systems, Dead Reckonings: Lost Art in the Mathematical Sciences. http://myreckonings.com/wordpress/2010/05/05/lallemands-labaque-triomphe-hexagonal-charts-and-triangular-coordinate-systems-part-i/
Evesham H. A., The History and Development of Nomography, Ph.D. Thesis, University of London, 1982. http://hdl.handle.net/10547/581287
Evesham, H. A. (1986). Origins and Development of Nomography. IEEE Annals of the History of Computing, 8(4), 324–333. doi:10.1109/mahc.1986.10059
Evesham H.A., 2010, The History and Development of Nomography, Docent Press. Dec 26, 2010, ISBN/EAN13: 1456479628 / 9781456479626
Grimes D.A., The Nomogram Epidemic: Resurgence of a Medical Relic, Ann Intern Med. 2008; 149(4), 273-275. DOI: 10.7326/0003-4819-149-4-200808190-00010
Hankins T.L. , Blood, Dirt, and Nomograms. A particular history of graphs, Isis, 90 (1999), 50-80.
Kattana M.W., Marasco J., 2010, What Is a Real Nomogram? Seminars in Oncology. 37, N°1, pp.23-26 https://doi.org/10.1053/j.seminoncol.2009.12.003
Kämtz L. F. Cours Complet De Météorologie, trad. De L’allemand et Annoté par Charles Martins, avec un Appendice contenant la Représentation Graphique des Tableaux Numériques, par Léon Lalanne, Paris : Paulin, 1843 ; 2ed., Paris : Delahays, 1858.
Kühn (Klaus) & Kleine (Karl) (éds), Dennert & Pape ARISTO 1872-1978, München : W. Zuckschwerdt Verlag, 2004.
Lalanne L. . Sur las tables graphiques et sur la geometrie anamorphique. Anna. des Pants et Chaussees, 1846, vol. XI, 1-69.
Lalanne, L.,1846, Mémoire sur les tables graphiques et la géométrie anamorphique : appliquées à diverses questions qui se rattachent à l’art de l’ingénieur. Paris : Carilian-Goeury et Vor Dalmont, ETH-Bibliothek Zürich, Rar 22663, https://doi.org/10.3931/e-rara-60464 /
Lalanne L. . Memoire sur la substitution de plans topographiques a des tables numériques a double entree. C.R. l’Academie des Sciences, (Paris), 1843, 1162-1164.
Lecornu L; ,Sur le Problème de l’Anamorphose, Comptes Rendus Hebdomadaires des Séances de l’Académie des Sciences, 1886, 102, p. 813-816.
Lallemand C. ,Les Abaques Hexagonaux. Nouvelle Méthode Générale de Calcul Graphique, Avec de Nombreux Exemples d’Application, Notamment au Calcul des Profils en Travers dans les Projets de Chemins de Fer, de Canaux, de Routes, etc., À la Poussée des Terres, au Calcul des Intérêts Composés, à Plusieurs Problèmes Usuels de Géométrie, au Calcul des Erreurs dans le Nivellement, Etc., Paris : Ministère des Travaux Publics, 1885.
Lallemand C., Sur une Nouvelle Méthode Générale de Calcul Graphique au Moyen Des Abaques Hexagonaux, Comptes Rendus Hebdomadaires des Séances de l’Académie des Sciences, 1886, 102, p. 816-819. https://ia802907.us.archive.org/17/items/ComptesRendusAcademieDesSciences0102/ComptesRendusAcadmieDesSciences-Tome102-Janvier-juin1886.pdf
Lallemand C., Nivellement de Haute Précision,Paris:Baudry, 1889.
Lallemand C., 1922a. Sur la Genèse et l’Etat Actuel de la Science des Abaques, Comptes Rendus Hebdomadaires des Séances de l’Académie des Sciences, 174, p. 82-88.
Lallemand C., 1922b. Sur les Avantages Comparés des Abaques Hexagonaux et des Abaques à Points Alignés, Comptes Rendus Hebdomadaires des Séances de l’Académie des Sciences, 174, p. 253-258.
Lecornu L. ,Sur le Problème de l’Anamorphose, Comptes Rendus Hebdomadaires des Séances de l’Académie des Sciences, 102 (1886), p. 813-816.
Marras N., 2018, Was there life before computers. http://www.nicolamarras.it/calcolatoria/
Massau J. , Mémoire sur l’intégration graphique et ses applications. Livre III. Calcul d’un projet de route, Annales de l’Association des ingénieurs sortis des écoles spéciales de Gand, 7 (1884), p. 53-132 + pl. 4-8.
Massau J. , Mémoire sur l’intégration graphique et ses applications. Livre IV. Application à la stabilité des constructions en maçonneries, Annales de l’Association des ingénieurs sortis des écoles spéciales de Gand, 10 (1887), p. 1-535 + pl. 1-7.
Ocagne, M. d’ 1884a. Procede nouveau de calcul graphique. Annales des Ponts et Chaussdes, Vol. VIII, pp. 531-540.
Ocagne, M.d’, 1884b. Etude de deux systbmes simples de coordonnees tangentielles dans le plan. Nouvelles Annales de Mathematiques, 3d series, Vol. III, pp. 410-470.
Ocagne M. d’, Nomographie. Les calculs usuels effectués au moyen des abaques, Paris : Gauthier-Villars, 1891. https://archive.org/details/nomographielescaOOdoca
Ocagne, M. 1924, d’ ,Calcul graphique et nomographie, Paris:Doin,1908; 2e éd. revue et corrigée, 1914 ; 3e éd., 1924. https://gallica.bnf.fr/ark:/12148/bpt6k9818394m.texteImage
Plucker, J. 1830. Journal für die Reine und Angewande Mathematik, Vol. 6, pp. 107-146.
Poignon P. Les Nouveaux Documents du Dessinateur. Editions Pierron. Sarregeumines-Moselle.
Pouchet L.E. [1795b] Arithmétique linéaire, ou Nouvelle méthode abrégée de calculer, que l’on peut pratiquer sans savoir lire ni écrire, Rouen : Guedra, an IV.
Pouchet L.E., 1797. Métrologie terrestre, ou Tables des nouveaux poids, mesures et monnoies de France, 3e ́ed., Rouen : Guilbert et Herment, an V. /https://gallica.bnf.fr/ark:/12148/bpt6k9640411j/f7.image.texte Image
“PyNomo”, Python Nomography program www.pynomo.org
Saint-Robert de, P. , 1871, De la résolution de certaines équations à trois variables par le moyen d’une règle glissante. Caractère auquel on reconnaît qu’une telle résolution est possible. Graduation à la règle. Mem. di Torino XXV (1871), p. 53-72.
https://ia801601.us.archive.org/4/items/mobot32044093290583/mobot32044093290583.pdf
Tournès D. . Abaques et nomogrammes. 2016. (hal-01484563), https://hal.archives-ouvertes.fr/hal-01484563
Tournès D., Pour Une Histoire Du Calcul Graphique, Revue d’Histoire des Mathématiques, V6, 2000, p. 127-161
Tournès D and Busser A.,2014. Une exposition sur les abaques et nomogrammes de multiplication, http://irem.univ-reunion.fr/spip.php?article788

